Welcome to week 3 of my redesign! The main AI news of the week is that humans decided that the lesson to be learned from social media in the modern age is that AI agents should do it too.
However, there was a much more interesting (to me) post by Anthropic called “How AI assistance impacts the formation of coding skills”. In short, Anthropic conducted a small randomized trial with junior developers learning a new Python library. I’ll let you read the article and corresponding paper, but the upshot is that AI-assisted programmers were negligibly faster at completing a task, but performed substantially worse on a subsequent quiz about the library they just learned.
Here’s the part of the post that I found most interesting (emphasis mine):
We split the study into three parts: a warm-up; the main task consisting of coding two different features using Trio (which requires understanding concepts related to asynchronous programming, a skill often learned in a professional setting); and a quiz. We told participants that a quiz would follow the task, but encouraged them to work as quickly as possible.
Participants having a task that they need to complete as fast as possible, knowing that they also needed to learn it for a subsequent assessment? Sounds a hell of a lot like a time-crunched student completing a problem set to me!
(There’s other stuff about how some developers used AI to learn more effectively, but that finding is about 12 individuals, and the kind of post-hoc analysis that should be taken as highly correlational.)
I’ll return to this study at the end of this post. Let’s go!
Step 1, a.k.a. Airport ideas
For those who have been reading, I ended my last post with a call to map our courses in a three step process, which I’ll be doing for my course over the next few weeks:
- Step 1: What are the learning objectives for my course?
- Step 2: What outputs do I use as proxies for those objectives?
- Step 3: Is it possible to reliably assess those proxies?
When it comes to step 1 of this process, I feel well placed. That’s because my mentor Dan Levy, a teacher so good that a student wrote an entire book about him, always taught me to think about my course in terms of “airport ideas”. As he put it (emphasis added):
“I always think, what are the one or two things I absolutely want students to take away from this course?” said Levy. What are the handful of things that seep “so much in your bones that you’ll still remember them five years later when I run into you at the airport”? (And in case audience members wondered, Levy does run into former students at the airport, as evidenced by the photos he showed on a pull-down screen.)
As a result of Dan’s work and mentorship, airport ideas are deeply baked into my course. Here are the six that we’ve focused on for the past several iterations of the course:
- Understand what each statistic tells you and what it doesn’t
- The world is more uncertain than you think
- Think like a Bayesian
- Remember when your data is a sample
- Beware the limitations of binary statistical significance
- Investigate alternative explanations for the results being presented
These Airport Ideas have been the “north star” of the course, but they need to be operationalized. How do these relate to the nitty gritty goals of individual class sessions, exercises, and assignments? I spent the last week mapping the different learning objectives and skills of the current iteration of my course onto these airport ideas. With the intellectual help of my colleague and co-instructor Jonathan Borck, and the tireless technical help of Claude Code, I have fleshed out each airport idea with a set of learning objectives that we currently teach.
Take a look here, but please don’t click the “Reassess” button yet!
You’ll notice that there’s a seventh section called “Excel Proficiency” – more on that later.
Taking Stock
With these airport ideas and learning objectives in hand, I wanted to think through what I might change in two ways:
- Relevance: Is this objective more relevant than before, as relevant as before, or less relevant than before?
- Delivery: Is our current approach to delivering this content sufficient, or does it need to be reassessed given what’s now possible?
These are both hard questions and will require lots of iteration. To figure out how to present that to you, reader, I had Claude Code add a “Reassess” button to my Airport Ideas page – once you click it you get columns for each of the two dimensions which you can populate and see a live count up top. You can also click “Show Teddy’s Plan” to see what I chose for each.
Ok, now you can click “Reassess” and “Show Teddy’s Plan” to see my first pass.
(As an aside, Claude Code has become a central part of my daily workflow. The last time I remember feeling this “oh wow” moment was the first time I tried ChatGPT.)
So here’s where this leaves me:
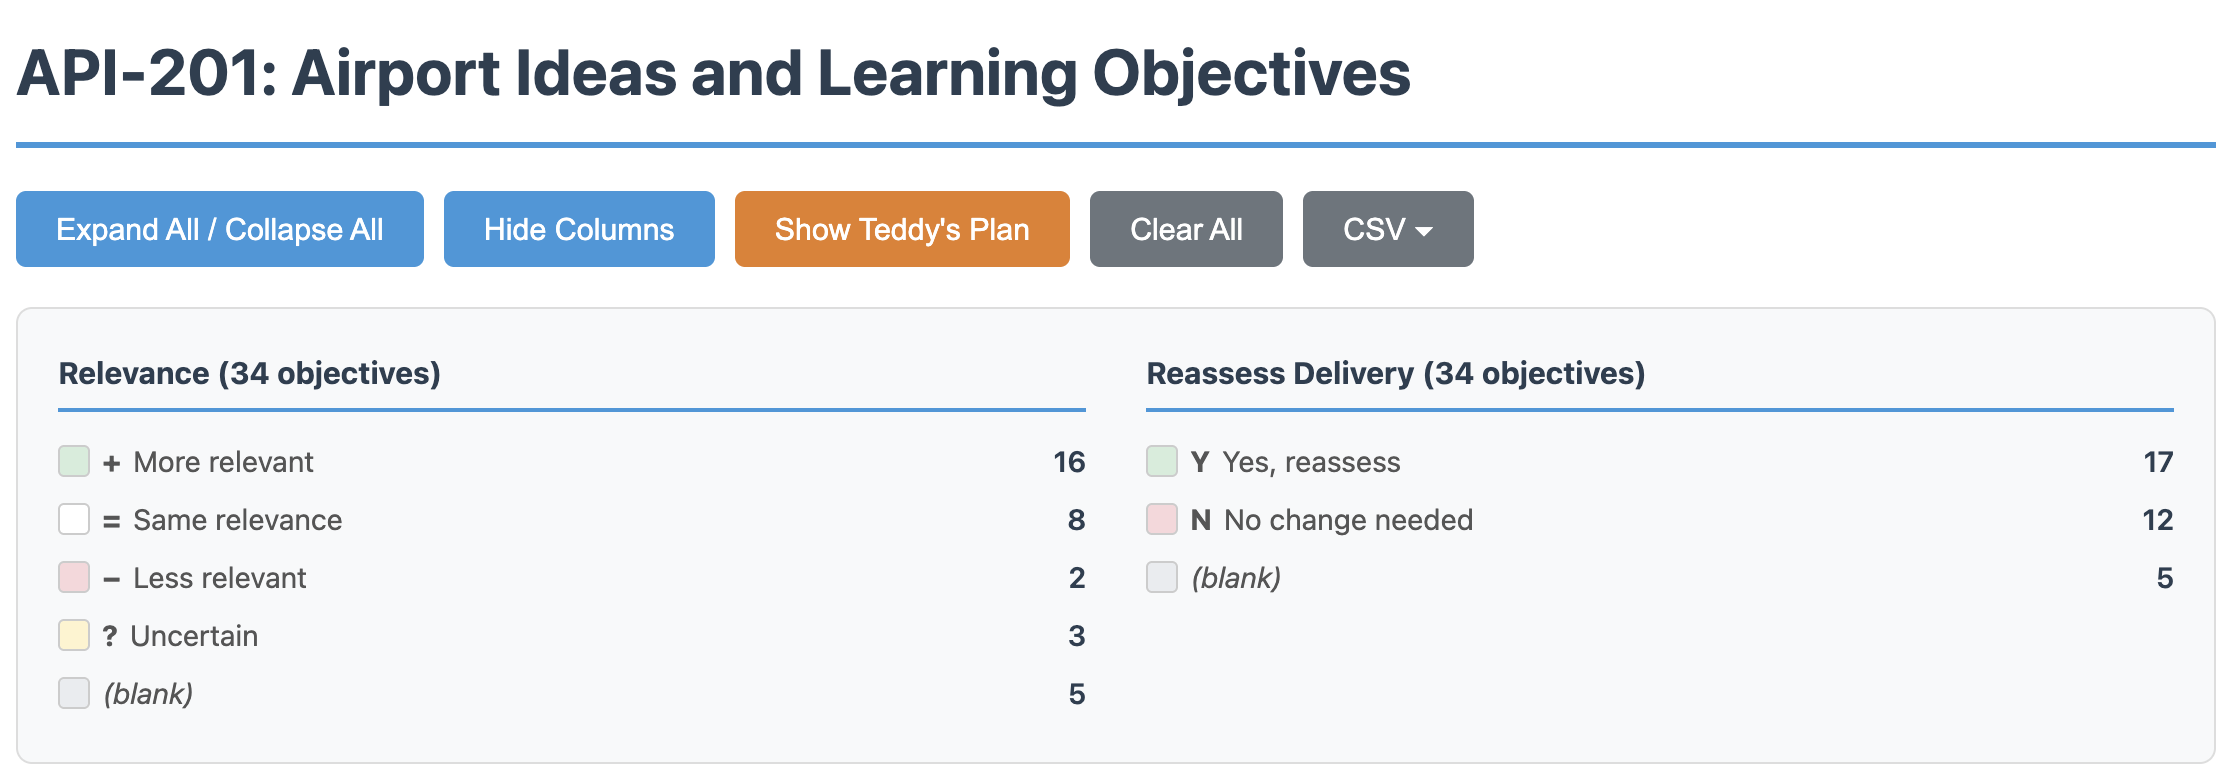
Very few of my learning objectives emerged unscathed, but a plurality of them are now “more important” than before. As I look at the list, much of this stems from the fact that I believe students will be encountering more and more statistical claims in the world, as it becomes easier for folks to point an AI tool at data, have it perform an analysis, and create a nice looking report. The formality of an analysis used to be an imperfect-but-correlated measure of rigor, but that correlation is hurtling toward zero. We’ve all encountered AI generated content that looks great but, after just a little bit of scrutiny, quickly falls apart. In our course we often used tweets and lazy articles to help students parse apart issues in statistical reasoning; going forward I think we need to make critique of more complex statistical analyses a more visible part of the course.
On the delivery side, I want to deliver a majority of these objectives differently. When I say “differently” here, I mean more than just “use a course chatbot”. Rather, we can start to incorporate way more sophisticated simulations and extensions into the learning process than we used to be able to. An example: when teaching the Central Limit Theorem last semester, I created an exercise where students uploaded a dataset and took lots of samples of certain sizes to manually create a sampling distribution. They could then choose larger or smaller sample sizes, and empirically see how sampling distributions change. This is the kind of simulation that I would reserve for more coding-oriented statistics courses; with well-prompted AI tools, this becomes trivial. I see lots of places where this could be expanded – understanding power at a conceptual level, seeing how summary statistics can mislead with different types of data, actually estimating probabilities for decision analysis problems – to accompany the more conceptual parts of the course.
Two Elephants in the Room
You may have noticed that there are two big missing components to all of this. First, the “Excel Proficiency” section at the bottom of the page. Teaching students how to use Excel effectively has long been a component of the course, albeit a secondary, parallel one. The reasons were twofold:
- Manipulating data in Excel can deepen the conceptual understanding of statistical concepts;
- Students should really know how to use Excel for statistical analysis when they go out into the workforce.
At the moment, both of these justifications feel weaker than before. The capabilities of AI to write and run code could certainly help students understand concepts more deeply than struggling with formula syntax in Excel. I know many colleagues will say that you cannot truly understand data analysis if you aren’t getting your hands dirty. I agree with this somewhat, but I want to spend some time thinking about what “hands” are and what “dirty” means in our current reality.
As for the second justification, the importance of spreadsheet competence in the professional world may not be over, but it is at least changing in a significant way. We of course want students to be able to open a CSV of survey responses and make sense of it, or read through a budget and suggest changes. But it’s not at all clear to me that Microsoft Excel or Google Sheets will remain the tool for this job.
Which brings me to the second elephant in the room: my list of learning objectives currently lacks new objectives necessitated by the ubiquity of AI. What capabilities do I want to make sure students have to work with AI tools more effectively? What does it mean to be “good” at working with AI (I unfortunately don’t think “prompting well” is sufficient)? How can I make sure that students are able to adapt their abilities as the set of AI capabilities suddenly shifts? To what extent are these unique skills versus ones that are embedded in the other learning objectives of the course?
As I think about this, the Anthropic study continues to bother me. There is a path I can take wherein more of the mechanical work in my course is offloaded to AI, so that I can focus on the deeper conceptual questions. But, in the Anthropic study, the act of trying to figure out how this library works and manually coding a solution with it seemed to have led to a stronger understanding, at least in the short term. Results like this, combined with my feeling that friction is where learning happens, makes me want to approach this redesign with more care, even for seemingly obvious cuts. In short, I need to make sure that I don’t subconsciously lower the bar of competence as I try to build a toolset for the coming years. This will involve some hard tradeoffs that I’m just starting to touch on. Good thing I’m on sabbatical.
Thanks for reading and please share your thoughts!